Though still over a year away, next year’s presidential election is already feeding into news stories and advertisements. Like every previous election, the state of the economy and financial markets will be a hot topic of debate among voters and candidates alike. But how do the markets perform in the year of a Presidential election? How will it impact market performance for the rest of their term?
Election-Induced Volatility
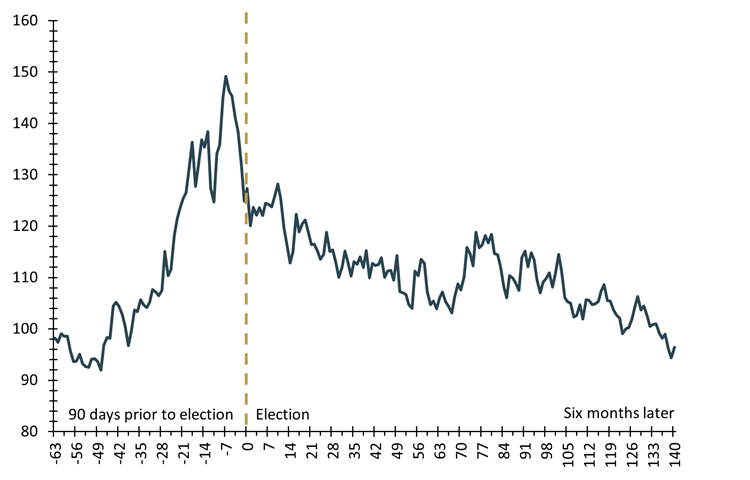
It likely won’t be a surprise to learn that markets tend to be more volatile in the months preceding a presidential election. As the two main candidates battle for votes with competing visions of the country, investors grapple with how each vision will impact the economy and various businesses. As such, day-to-day swings in stock prices tend to be elevated. One measure of volatility, known as the VIX, has climbed 30% in the 90 days leading up to election day, on average since 1992.
Once the election happens – and often even before election day – volatility quickly subsides, continuing on a downward trajectory for the next six months only to end pretty much where it began.
Volatility around Elections
VIX index, indexed to 100, 1992-2020

The Presidential Cycle
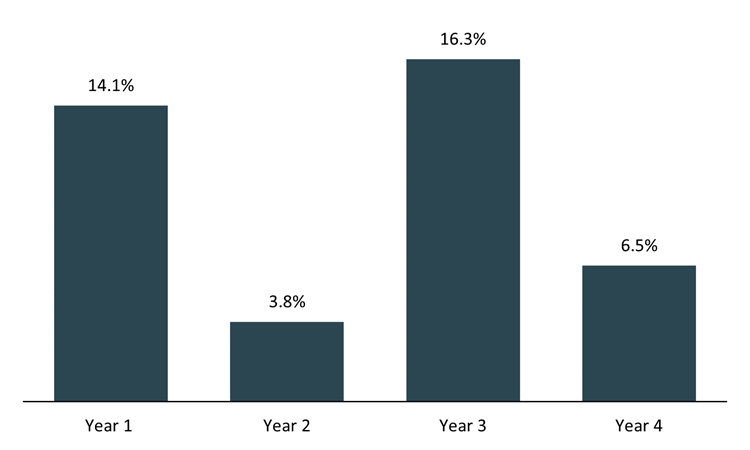
In addition to changes in volatility around elections, stocks also tend follow a discernable pattern depending on how far into a president’s term we are. While there are notable exceptions, the third year of a president’s term tends to be the best for stocks, which would correspond to this year, the third of President Joe Biden’s presidential term.
One theory for this positive performance is that the party in power tends to spend more before an election, driving economic growth and stocks in the process, all in the hopes of helping its candidate at the polls the following year. Note that this pattern of strong stock performance in the third year holds true for both Republican and Democratic administrations.
Average S&P 500 Index Total Returns After Election Years 1976-2023

Managing Your Portfolio During an Election Year
While there are some patterns to be discerned around presidential elections, politics tends to have a fleeting impact on long-term stock performance. Remember, the stock market historically delivers positive returns over time. Professor Jeremy Siegel, author of the 1994 investment classic Stocks For The Long Run, who we’ve quoted here before, put it succinctly: “Bull markets and bear markets come and go, and it’s more to do with business cycles than presidents.”
Kestra Financial Article by Kara Murphy, CFA


