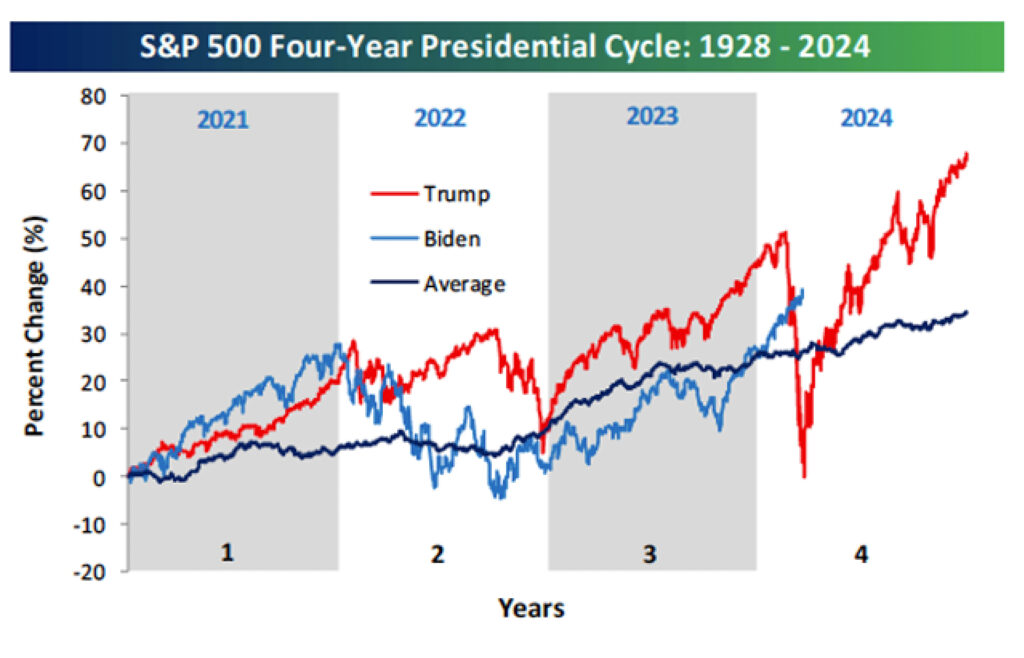
The chart below shows the average performance of the S&P 500 during the four-year Presidential Election Cycle for all administrations since Roosevelt’s first term.
The S&P 500 has tended to see the strongest performance in the last two years of the four-year cycle and ultimately ends with an average gain of 33.6%. Each of the last three four-year cycles have seen the S&P rise by more than 40%.
Past performance is no guarantee of future results
Republicans or Democrats? Does it Matter?
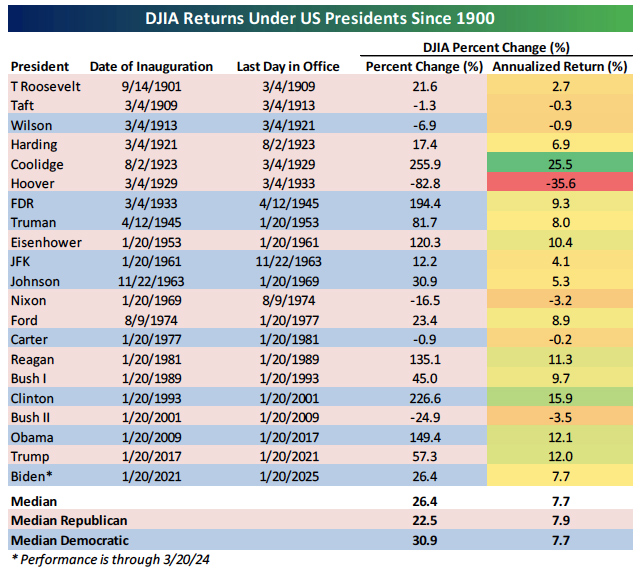
It has been conventional wisdom over the years that Republicans are better for the stock market than Democrats, but like a lot of conventional market wisdom, it isn’t always accurate. Looking strictly at returns of the Dow Jones Industrial Average since the start of 1900, median gross returns have been higher under Democrats (30.9%) than Republicans (22.5%), but there is some nuance to those results.
While median stock market performance has been better for Democratic Presidents,when we look at returns of each President on an annualized basis, the median performance of the Dow under Republican Presidents is slightly higher (7.9%) than Democratic Presidents (7.7%).
Within those median returns, however, there is tons of dispersion, so countless other factors besides who is in the White House have a larger impact on the performance of stocks.
Past performance is no guarantee of future results
Past performance is no guarantee of future results
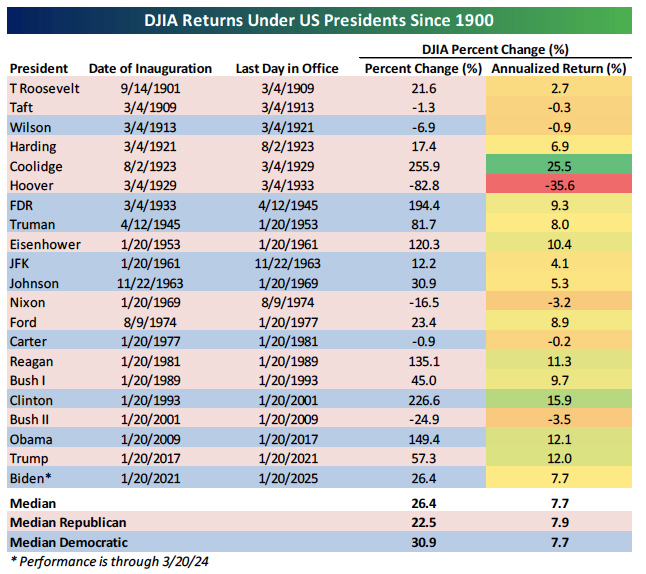
Even if we adjust stock market performance for each President based on when they were first elected or assumed office (in cases where they weren’t elected) rather than looking at Inauguration Day to Inauguration Day, the difference between Republican and Democratic Presidents doesn’t vary widely.
Looking at gross returns, performance again looks much better for Democrats than Republicans, but after adjusting returns on an annualized basis, the performance spread between the two parties is identical.
Past performance is no guarantee of future results
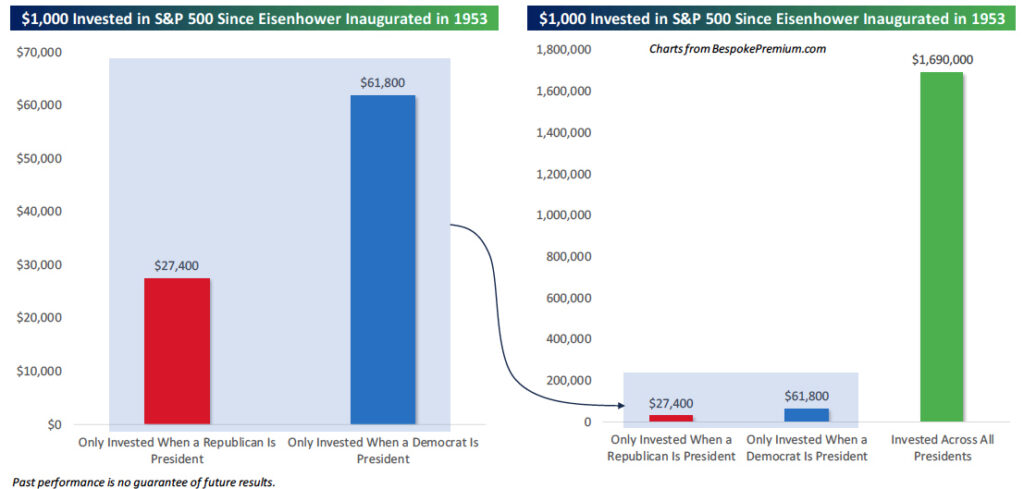
Don’t Get Political
Letting political beliefs get in the way of “Buy and Hold” has been extremely costly to investors. Going back 70 years, $1,000 invested in the US stock market only when a Republican is President would be worth $27,400 today. $1,000 invested only when a Democrat is President would be worth double that at $61,800. But that $1,000 would be worth $1.69 million today for those who put politics aside and stayed invested regardless of who’s in charge in Washington DC.
Past performance is no guarantee of future results
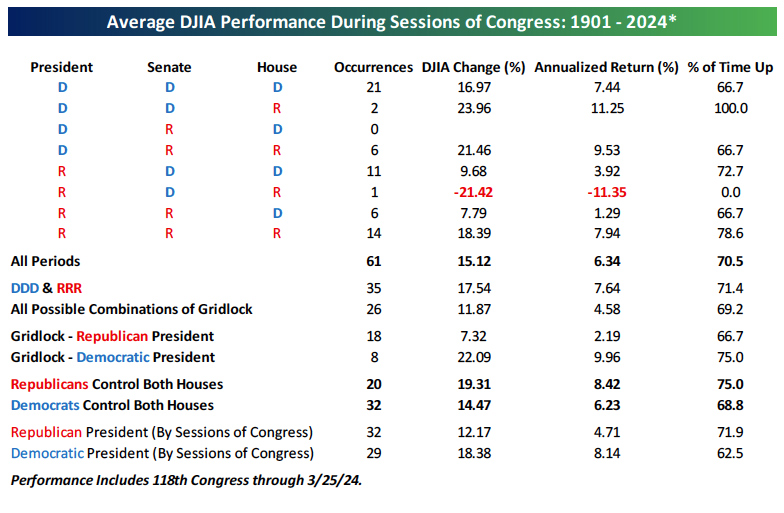
Who’s In Charge?
As discussed on the previous page, investing based on which party has the Presidency hasn’t exactly been a winning strategy historically. Expanding out, in the table below we show the average returns of the Dow for every session of Congress since the start of the 20th century based on the various combinations of Republicans and Democrats holding the Presidency, Senate, and House.
When Republicans controlled both houses of Congress, returns were modestly better than when Democrats controlled both chambers.
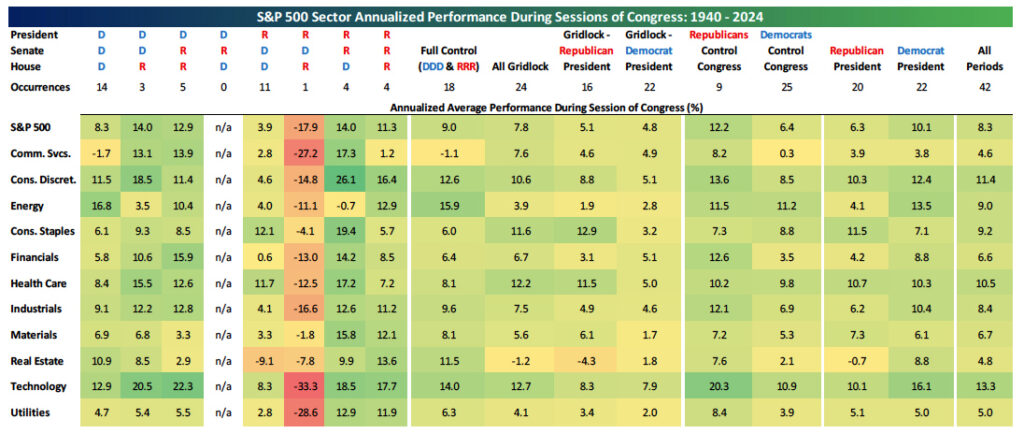
Like the previous page, below we show the average annualized performance of the S&P 500 and each of its eleven sectors during each session of Congress since 1940 broken down by the various possible outcomes of gridlock or party control. Again, equities have typically risen regardless of whether there was gridlock or if Republicans or Democrats were in charge.
Past performance is no guarantee of future results
Past performance is no guarantee of future results
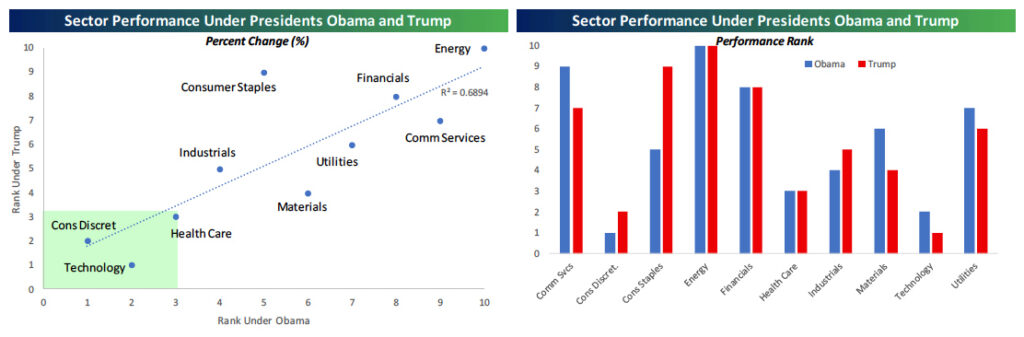
A Tale of Two Presidencies
The performance of sectors during the Presidencies of Obama and Trump shows that the impact of the person in the Oval Office may not be as significant as often assumed. While the two were polar opposites in terms of policy and style, the stock market sectors that led and lagged during each President’s tenure were largely the same.
In President Obama’s eight years, the three top performing sectors were Consumer Discretionary, Technology, and Health Care. For Trump, the three top performing sectors were the same. Likewise, Energy was the worst performing sector for both Presidents, and Financials was in the bottom three. Besides Consumer Staples, no other sector’s rank is different by more than two spots for each President.
Past performance is no guarantee of future results
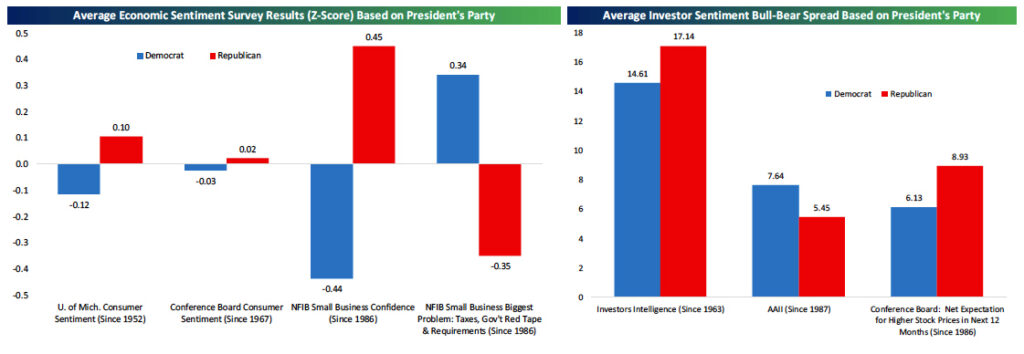
Consumer and Investor Favoritism
Having biases is typical human behavior, especially when it comes to one’s political leanings. Republicans are typically viewed as more business friendly than Democrats, and that shows through economic sentiment data. In the left chart below, we show the average standardized consumer and business sentiment readings across a variety of surveys based on which party holds the Presidency.
Consumer sentiment has historically held a small positive bias for Republican administrations. For small business sentiment and the rate at which those firms report the government as their biggest problem, the dichotomy is even more pronounced. Similarly, save for the AAII investor survey, expectations for higher stock prices tend to be stronger during Republican administrations than Democratic ones (right chart).
Past performance is no guarantee of future results
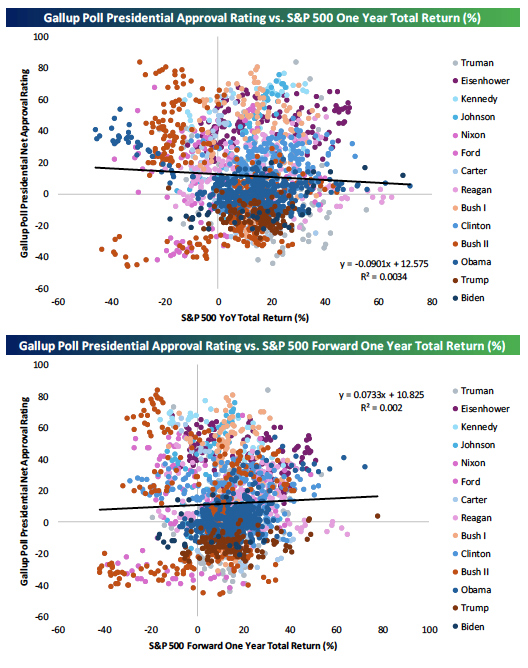
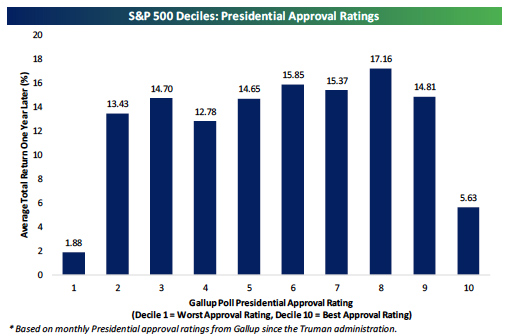
Stocks Don’t Approve or Disapprove
The Commander-in-Chief gets most of the political attention in the US, and since the mid-1940s, Gallup has been surveying Americans on their approval of the President. As shown at right, going back to the Truman administration, there has been little correlation between approval ratings and S&P 500 returns both over the trailing 12-month and forward 12-month periods. Similarly, breaking approval ratings down by decile (chart below) shows little in the way of a clear trend. Forward returns have been the weakest when approval ratings have been both at their strongest and weakest.
Past performance is no guarantee of future results
Past performance is no guarantee of future results
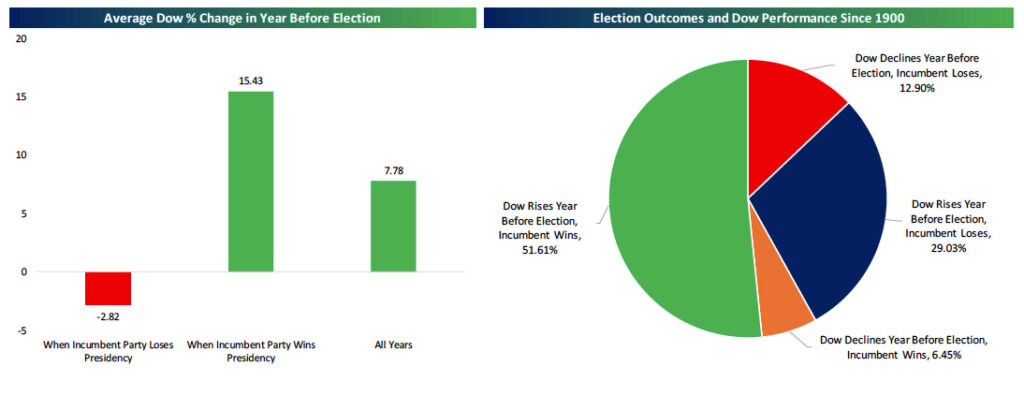
Do Stocks Predict Elections?
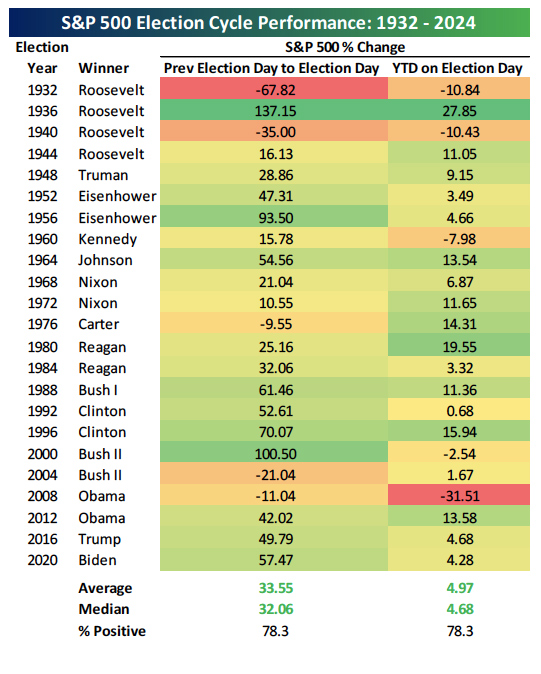
There are a multitude of reasons why a candidate may or may not make their way into office, but the stock market’s performance in the year leading up to Election Day is a pretty good tell. As shown in the left chart below, when an incumbent party has won the Presidency, the Dow has averaged a 15.4% gain in the year leading up to the election. That compares to an average decline of 2.8% in election years when the incumbent party has lost.
Past performance is no guarantee of future results
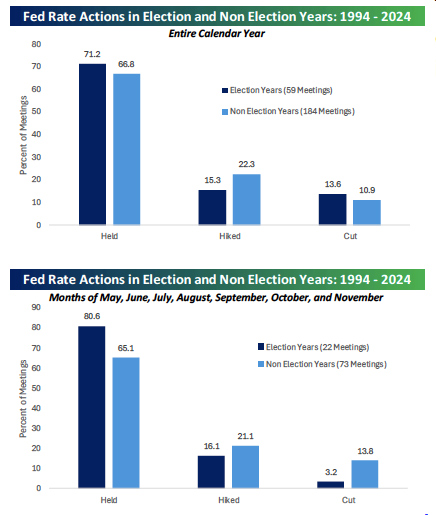
Is the Fed Political?
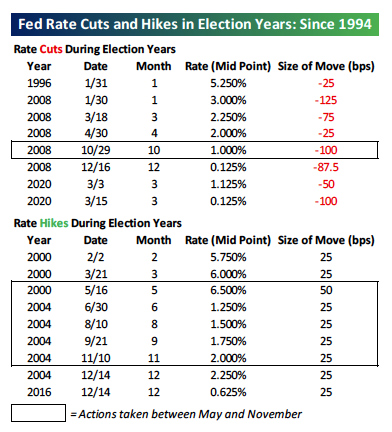
It’s hard to imagine any aspect of society being apolitical these days, but the Federal Reserve has maintained a pretty middle stance. Since 1994, when its decisions were made public in real-time, the Fed has been more likely to stay on hold during Presidential election years, especially as Election Day gets closer. The Fed has hiked rates in an election year during the months of May through November just 16% of the time compared to 21% for all other years, and they’ve only cut rates 3% of the time compared to 14% of the time in other years.
The only time the Fed cut rates in May or later during an election year was in October 2008 when the economy was in free-fall and neither candidate was up for re-election.
Past performance is no guarantee of future results
Past performance is no guarantee of future results
About Bespoke Investment Group Visit BespokePremium.com to learn more about Bespoke Investment Group and its team.
Bespoke Investment Group, LLC believes all information contained in this report to be accurate, but we do not guarantee its accuracy. Data points and calculations in this report are as of August 2023. Calculations are hypothetical and do not represent actual investment results. Hypothetical performance analysis of the past is not replicable. No hypothetical fees or trading costs were included in this analysis, which can impact actual investment results. None of the information in this report or any opinions expressed constitutes a solicitation of the purchase or sale of any securities or commodities. This is not personalized advice. Investors should do their own research and/or work with an investment professional when making portfolio decisions. As always, past performance of any investment is not a guarantee of future results. Bespoke representatives or clients may have positions in securities discussed or mentioned in its published content.